Accounts Receivable Turnover Ratio: Formula, Examples, Benchmarks
The accounts receivable turnover ratio tells you how many times a year you collect your average receivables balance. Divide net credit sales by average accounts receivable: a higher number usually means customers pay faster.

- AR turnover formula
- Credit sales ÷ avg AR
- AR turnover in days
- 365 ÷ ratio
- Median collection, US listed companies, 2024
- 48 days
- Name of the ratio in ERPNext
- Debtor Turnover
The basics
What does the accounts receivable turnover ratio measure?
In one line
It measures how quickly credit sales turn into cash. A ratio of 8 means you collected your average receivables balance about eight times during the year. If it drops to 5, the same sales are sitting longer in customer accounts.
That one number answers the question every owner asks at month end: "We sold well, so where is the cash?" The rest of this guide covers the formula, two worked examples, accounts receivable turnover in days, industry benchmarks from US public company filings, the traps that make the ratio lie, and how to track it in ERPNext without a spreadsheet.
A high ratio usually signals
A conservative credit policy, an active collections team and good customers, according to AccountingTools.
A low ratio can point to
Loose credit, weak follow-up, customers in trouble, or bad debt that hasn't been written off yet.
People call the same number by several names. ERPNext's own report labels it "Debtor Turnover Ratio".
- Receivables turnover ratio
- Debtors turnover ratio (India, UK)
- AR turnover
- Debtor Turnover Ratio (ERPNext)
Formula
What is the accounts receivable turnover formula?
CFI defines net credit sales as credit sales minus sales returns and allowances. Average accounts receivable is the opening and closing balances added together and halved.
AccountingTools adds that a 12-month average gives a truer picture if your balances swing during the year. Pick a method and use it every period, or the trend means nothing.
Net credit sales ÷ Average AR
The accounts receivable turnover ratio, as CFI and AccountingTools both define it.
| Part | What goes in it | Common mistake |
|---|---|---|
| Net credit sales | Sales made on credit, minus returns and allowances | Using total sales, including cash and card sales |
| Average accounts receivable | (Opening AR + Closing AR) ÷ 2 for the period | Using only the closing balance |
| Period | Usually a year; a quarter or month works if you scale the days | Mixing a quarter's sales with a year's day count |
Worked examples
How do you calculate it? Two worked examples
These are illustrative numbers in any currency, not client data.
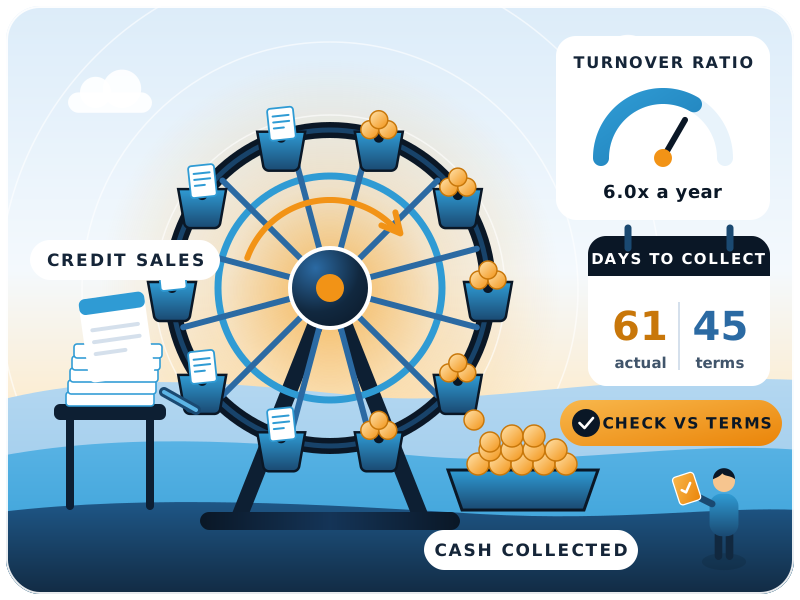
Example 1: a distributor with 45-day credit terms
- 1Net credit sales for the year6,000,000, after 200,000 of returns.
- 2Opening and closing AR800,000 on 1 April, 1,200,000 on 31 March.
- 3Average AR(800,000 + 1,200,000) ÷ 2 = 1,000,000.
- 4AR turnover6,000,000 ÷ 1,000,000 = 6.0 times.
- 5AR turnover in days365 ÷ 6.0 = about 61 days.
The distributor offers 45 days. Customers are taking about 61. That 16-day gap is cash the business is lending to its customers for free.
Example 2: same sales, tighter collections
A competitor sells the same 6,000,000 on credit, but its average AR is 650,000. On the same revenue it has 350,000 less tied up in receivables. That's money it doesn't need to borrow.
| Distributor A | Competitor B | |
|---|---|---|
| Net credit sales | 6,000,000 | 6,000,000 |
| Average AR | 1,000,000 | 650,000 |
| AR turnover | 6.0 times | about 9.2 times |
| AR turnover in days | about 61 | roughly 40 |
CFI's own worked example, a small bike shop, runs the same way and lands at about 7.2 times (CFI).
Turnover in days
How do you calculate accounts receivable turnover in days?
AR turnover in days = 365 ÷ AR turnover ratio. Divide the days in the period by the turnover ratio. Don't divide a quarterly ratio into 365.
The days figure is easier to explain to a sales team than the ratio. "Customers pay us in 61 days, our terms are 45" lands better than "our turnover is 6".
It's close to days sales outstanding (DSO), which many teams calculate as closing AR ÷ credit sales × days. The two differ mainly in whether you use the closing or the average balance, so pick one and stick with it.
- 365 ÷ ratio
- Full year, with the year's sales and average AR
- 91 or 92 ÷ ratio
- A quarter, with that quarter's sales and average AR
- Days in month ÷ ratio
- A single month, with that month's figures
Reading it
Is a higher or lower AR turnover ratio better?
Short answer
Higher is usually better. It means faster collection and less working capital stuck with customers. CFI calls a high ratio desirable and a low or falling ratio harmful (CFI).
There's a ceiling, though. AccountingTools warns that a very high ratio can mean credit terms are so tight that you lose sales, which hurts most when margins are high. The useful comparison is your days figure against your own credit terms, then against your industry.
Days close to your credit terms
Days well above terms
Ratio falling quarter after quarter
Ratio far above peers
Benchmarks
What is a good AR turnover ratio by industry?
There's no single good number. It depends on how your industry sells. The table uses ReadyRatios' median receivables turnover in days for US listed companies, calculated from SEC filings, for 2024 (2,851 companies in the all-industries figure). We converted days to an approximate ratio with 365 ÷ days.
| Industry (SIC group) | Median days, 2024 | Approx. turnover |
|---|---|---|
| All industries | 48 | 7.6 |
| General merchandise stores | 3 | 122 |
| Wholesale, non-durable goods | 25 | 14.6 |
| Food and kindred products | 30 | 12.2 |
| Wholesale, durable goods | 44 | 8.3 |
| Health services | 47 | 7.8 |
| Fabricated metal products | 51 | 7.2 |
| Business services | 57 | 6.4 |
| Chemicals and allied products | 60 | 6.1 |
| Engineering, accounting, research, management | 60 | 6.1 |
| Industrial machinery and computers | 63 | 5.8 |
| Special trade contractors | 74 | 4.9 |
| Legal services | 81 | 4.5 |
Retailers collect almost at once because shoppers pay at the till. Machinery makers, chemical companies and professional firms wait two months or more. These are US public companies, so treat them as a rough guide. A mid-sized Indian manufacturer selling to dealers can sit well outside these figures. Your own trend over eight quarters matters more than any benchmark.
Watch out
Why can the ratio mislead you?
We've seen finance teams act on a turnover number that was wrong before anyone looked at a single customer. Watch for these five things:
Cash sales in the numerator
Two-point averages
Seasonality
Your own billing errors
One big customer
Improve it
How do you improve the accounts receivable turnover ratio?
Most improvements come from a few habits, not a new tool. Here's the order we usually follow in ERPNext projects:
- 1Set credit limits per customerIn ERPNext, the Credit Limit table on the Customer blocks new orders above the limit unless someone with the right role approves them.
- 2Put payment terms on every invoiceA Payment Terms Template sets due dates on each Sales Invoice, so ageing runs on the real due date.
- 3Invoice the day you deliver, and get it rightLate or wrong invoices push the whole collection cycle back.
- 4Offer an early-payment discount where margins allowERPNext payment terms have discount fields (type, amount and validity), so the discount is calculated, not negotiated by email.
- 5Make paying easyA Payment Request sends the customer a payment link with the invoice.
- 6Follow up on a fixed scheduleDunning in ERPNext creates reminder letters for overdue invoices, with a dunning fee and interest rate you set per dunning type.
- 7Review ageing every weekThe Accounts Receivable report ages by due date by default, in 30, 60, 90 and 120-day buckets you can change.
AI can take over the routine part of steps 6 and 7: drafting the reminder, matching incoming payments to invoices and flagging customers whose payment pattern is changing. We cover that in our guide to accounts receivable and how AI automates it in ERPNext. The rule we follow is simple: AI drafts, a person approves anything that goes to a customer.
In ERPNext
How do you track AR turnover in ERPNext?
ERPNext has a Financial Ratios report under Accounting (listed in the accounting reports). In the version 16 source code, its "Debtor Turnover Ratio" divides net sales (the Direct Income accounts) by the average of the opening and closing balances of all Receivable-type accounts for each period. It also shows creditor and inventory turnover beside it.
For a monthly view, a number card or dashboard chart on the receivables workspace, built from the same data, lets the finance head see the trend without running a report.
Direct Income ÷ avg Receivable
How ERPNext's Financial Ratios report works out the Debtor Turnover Ratio for each period, per the version 16 source code.
Three practical points from setting this up
- Keep Receivable accounts clean. Advances parked in the debtors account, or customer balances posted to a general ledger account without the Receivable type, distort the average.
- Map income accounts correctly. Only accounts under Direct Income count as sales in this report.
- Pair the ratio with the Accounts Receivable report. The ratio tells you whether things are getting better or worse. The ageing tells you which customers to call.
Limits
When is AR turnover the wrong metric?
Mostly cash, card or prepaid sales
A few large milestone invoices
Next step
What should you do next?
- 1Work out four quartersCalculate your ratio and your days for the last four quarters, using credit sales and a monthly average.
- 2Put the days next to your termsCompare collection days with the credit terms you actually offer.
- 3Start with the biggest gapsIf the gap is more than a couple of weeks, open the ageing report and begin with the five biggest overdue customers.
If you run ERPNext and the Financial Ratios report gives numbers you don't trust, the cause is usually account mapping, not the formula. FinByz has worked on ERPNext since 2016, across 200+ projects in 15+ countries, and this clean-up is a common first step for us. Our ERPNext accounting transaction audit checks exactly this, and if you need hands on the ledger every month, you can hire an ERPNext accountant. On the payables side, the accounts payable payment management report gives the same kind of view of what you owe.
Sources
- AccountingTools, Accounts receivable turnover ratio definition (Steven Bragg), 7 May 2026
- Corporate Finance Institute, Accounts Receivable Turnover Ratio, published 31 Aug 2019
- ReadyRatios, Receivables turnover (days), breakdown by industry, US listed companies from SEC filings, 2024 medians, accessed 19 Nov 2026
- ERPNext source code, Financial Ratios report (financial_ratios.py), checked 19 Nov 2026
- ERPNext documentation, Accounting Reports